The average US household is absorbing roughly $1,500–$2,500 more per year in tariff-related costs in 2026, according to the Tax Foundation and Yale Budget Lab estimates. For a family of four spending the USDA moderate-cost average of ~$1,430 per month on groceries, that translates to an added $45–80 per month at checkout — money quietly disappearing without a label. The only way to see your household’s actual tariff exposure is to track it manually by category, because no bank algorithm separates “tariff markup” from “regular price increase.”
Your Grocery Bill Has a New Line Item
Federal Reserve researchers confirmed in May 2026 that tariff costs pass fully through to consumers — if a retailer’s acquisition cost rises $1.00 from tariffs, the retail price rises $1.00 within about seven months. The Dallas Fed estimated tariff collections added approximately 0.80 percentage points to March 2026 core PCE inflation, meaning tariff effects are visible in the data, not theoretical.
For shoppers, this is now playing out at Costco, Whole Foods, Target, and neighborhood stores alike. Prices have not spiked identically everywhere — some categories have absorbed more cost, others are still catching up. Mid-2026 is roughly the “full pass-through” window that researchers predicted: the tariffs applied in late 2025 and early 2026 have had enough time to work through the supply chain.
Coffee is up nearly 20 percent. Fresh avocados, tomatoes, limes, and bell peppers from Mexico face 25% tariffs. Extra-virgin olive oil and Italian pasta — including some brands facing combined duties up to 107% — have repriced significantly at specialty grocers and Trader Joe’s. These are not fringe categories; they are staples in millions of American kitchens.
What’s Getting More Expensive in 2026
Not every aisle is equally affected. Here is where tariff exposure is highest:
| Category | Primary Tariff Driver | Estimated Price Impact |
|---|---|---|
| Fresh produce (avocados, limes, tomatoes) | 25% Mexico tariff | High |
| Italian pasta and imported noodles | Up to 107% combined duty | Very high |
| Extra-virgin olive oil | 15% EU tariff | High |
| Coffee and cocoa products | Commodity + tariff stacking | High (~20%) |
| Canned seafood and imported fish | Varied by origin | Medium–high |
| Domestic beef and veal | Demand displacement | Medium |
| Wine and imported beverages | 15% EU tariff | Medium |
| Packaged goods with imported ingredients | Supply chain layering | Low–medium |
The categories with low-to-medium impact are not immune — they simply take longer. Food industry analysts expect packaged goods to catch up to their input-cost increases in Q3–Q4 2026.
The Tracking Problem No App Solves
Most budgeting apps pull transactions from your bank and categorize them as “Groceries.” That is useful, but it tells you nothing about why your grocery total is higher than last year. The bank does not know if your Whole Foods receipt is up $35 because you bought more items, chose more expensive brands, or paid tariff-inflated prices on your usual staples.
Manual, category-level tracking is the only method that gives you this visibility — and it requires intentional data collection, not automation. Tefteri is built for exactly this approach: log each grocery run with an amount and a note, and compare month-over-month totals without sharing your bank credentials with any third-party service. Privacy-first tracking means the numbers stay on your device, not in a fintech company’s database.
The goal is not to achieve academic precision. The goal is to see whether your grocery total in June 2026 is meaningfully higher than January 2025 — and if so, how much of that difference comes from buying the same things at higher prices versus buying more or different things.
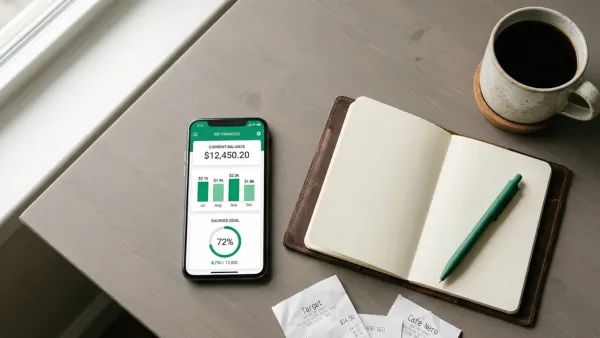
How to Build Your Personal Tariff Tracker
This is a four-step process you can start this week. No spreadsheets required, though a simple one works fine.
Step 1: Establish your January 2025 baseline. Look at your bank or credit card statements from January 2025 — before most tariffs took effect — and find your average monthly spend on groceries and household goods. If you do not have that data, estimate it. Write it down.
Step 2: Define your tracking categories. Do not track “groceries” as one bucket. Split it at minimum into: produce and fresh items, pantry staples (canned goods, pasta, rice), coffee and beverages, and household goods (cleaning products, paper products). This separation matters because tariff exposure varies significantly by category.
Step 3: Log actual monthly spending in each category. Save your receipts for one full month and total each category. If you shop at multiple stores — Trader Joe’s for olive oil, Costco in bulk, a local market for produce — total across all of them.
Step 4: Compare and annotate. When June or July spending is $60 higher than your January 2025 baseline, note which categories drove it. If your produce spend is up 18% and your pantry staples are up 31% but you bought the same quantities, you are looking at price increases — likely tariff-driven in those specific categories.
![]()
What to Do Once You Have the Numbers
Knowing your tariff exposure does not mean you have to absorb it passively. Once you see which categories are driving your grocery total up, you have real options:
Switch sourcing on the most-tariffed items. If avocados from Mexico are markedly more expensive, California-grown or domestic-substitute produce may be cost-competitive for the first time in years. Domestic pasta brands avoid the EU and Italian import duties entirely.
Adjust the budget, not just the spending. If your grocery baseline has genuinely shifted — not due to buying more, but due to price increases — your grocery budget needs updating to reflect the new normal. Treating a structurally higher bill as a “bad month” every month is a budgeting error, not a discipline problem.
Redirect savings from less-affected categories. You probably have categories where tariff impact is low — domestic produce, bulk dry goods from Costco, store-brand proteins. If you can shift basket composition toward lower-tariff items, some of the exposure is recoverable without major lifestyle changes.
Build a tariff buffer into your emergency fund math. The standard advice is three to six months of expenses. If your household expenses have increased $150–200 per month from tariff pass-through alone, your emergency fund target has moved too. Re-running that calculation is worth a few minutes this summer.
Tefteri makes the comparison step frictionless: log each month’s grocery total in the Housing or Personal domain, check the month-over-month trend in the dashboard, and you have a running record of what prices are actually doing to your budget — without linking a bank account or handing data to an algorithm.
Tefteri is a personal finance app for iPhone that helps you track expenses, income, and subscriptions — organized by category, stored locally on your device, and designed to make financial clarity effortless without bank linking.
Frequently Asked Questions
How much are 2026 tariffs adding to the average US grocery bill?
Estimates from the Tax Foundation and Yale Budget Lab put the average US household tariff cost at $1,500–$2,500 per year across all goods. For grocery-specific exposure, food industry analysts estimate a 5–8% effective increase on the most-affected categories (produce from Mexico, imported pasta and olive oil, coffee), with lower single-digit increases on domestic and less-tariffed items. For a family spending $1,430 per month on groceries, the realistic tariff-driven increase is $45–80 per month in 2026.
Which grocery store is least affected by tariffs?
No major US grocery chain is insulated from tariff effects, since all retailers source goods from tariffed countries. However, stores with a larger share of domestic-sourced products (certain discount chains, regional co-ops, stores with strong domestic meat and dairy programs) have lower import exposure. Warehouse clubs like Costco that buy in bulk often absorb more cost before passing it to consumers, but price increases still appear eventually.
Can I actually separate tariff costs from general inflation on my receipts?
Not on an item-by-item basis — receipts do not disclose tariff components. What you can do is compare category-level spending over time while controlling for quantity: if you bought the same number of avocados and limes in June 2026 as you did in January 2025, any price increase is a combination of general food inflation and tariff pass-through. The BLS tracks specific CPI subcategories, but your personal data from consistent tracking is more actionable for budgeting purposes.
Should I stock up on tariffed items now?
Stocking up makes sense for non-perishable, high-tariff items where storage is practical and you have the cash to do so without disrupting other budget categories. Italian pasta, olive oil, canned goods, and coffee are all reasonable candidates. Do not over-extend your budget to stockpile — the price difference on individual items is modest, and tying up cash in pantry inventory has an opportunity cost.
Is tracking grocery spending by category really worth the effort?
For most households, yes — but only if you actually use the data. The effort is a few minutes per shopping trip to log totals by category. The payoff is three months of trend data that tells you whether your spending increase is behavioral (buying more) or structural (prices up). That distinction determines whether you need a habit change or a budget update — and they require completely different responses.